Today, we celebrate the power of Geographic Information Systems (GIS) and the incredible impact it has on our world.
GIS is not just about creating maps; it’s about understanding our planet, making informed decisions, and solving real-world problems. GIS technology plays a crucial role in our daily lives at RAB Consultants. We explore a few projects and examples of how our team uses GIS technology as part of work activities.
Resilience
Our Resilience Team uses GIS for various tasks including the creation of maps and visual aids for training and exercises. In a recent Business Continuity flood exercise for the University of Salford, Saajeda produced multiple maps that highlighted flood extents and critical infrastructure, such as student accommodation and parking areas expected to be impacted during a significant flood event. These maps played a vital role in equipping responders with the necessary information to make informed decisions during the exercise.
Rebecca is seconded to the Environment Agency’s Evidence and Risk Inland Team. She uses GIS to review 1D/2D hydraulic models created using Flood Modeller and TUFLOW. Rebecca encourages the use of GIS as it allows her to construct 2D hydraulic models and visualise the 1D model schematisation. According to her, one of the advantages of using GIS is ‘that it allows for rapid visualisation of the model including node locations, structures and inflow / outflow boundaries as well as spatial data including the bed topography and flood outputs such as water depth and velocity’. Rebecca also has experience of using the TUFLOW viewer which allows her to animate and interpret the timing of the flood peak and flood extents. Finally, our Flood Forecasting and Warning Team use GIS to improve flood warning capabilities which warn and inform people and businesses before and during a flood event. You can find out more about what they do from our recent post:
Improvements to Flood Warnings Benefit National and Local Agencies
Flood Risk and Drainage
GIS plays a vital role within our Flood Risk and Drainage Team, allowing us to efficiently integrate and analyse extensive spatial data. This capability enables us to produce highly detailed and accurate flood risk assessments and drainage designs. Additionally, GIS enables our team to create high-quality visualisations, making it easier for clients who may not have technical expertise to comprehend the results and recommendations.
Our team uses GIS technology in a wide variety of ways, such as:
- To assess and analyse data outputs from 1D and 2D models.
- To estimate flood levels and evaluate the risk to proposed site or developments in the absence of modelled data.
- To view LiDAR data, helping us understand the topography of specific areas.
- To utilise satellite images to assess and extract historical flood extents.
- To determine the safest evacuation routes in the event of fluvial or surface water flooding scenarios.
- To create maps that display the risk of flooding in specific regions or areas.
Property Flood Resilience (PFR)
GIS plays a key role in our PFR projects, serving as a central hub for essential tasks. The GIS geodatabase stores occupant and site survey data, accessible to our surveyors through our dedicated data collection tool. This GIS-based tool enables real-time data collection and seamless integration with the database.
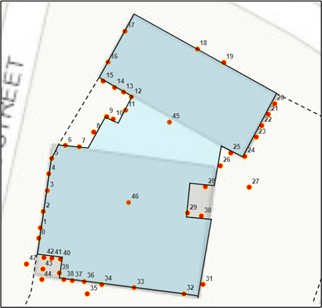
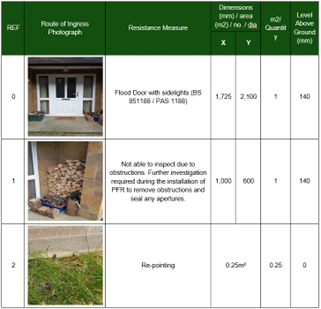
Surveyors use this tool to gather information on property details, historical flooding records, occupant mobility, and more. Additionally, they can conduct an above-ground photographic survey, document various property aspects, and establish Routes of Ingress (RoI) for flood assessment, streamlining the data collection process.
Upon completing the survey, an automation tool processes the data, automatically generating a comprehensive survey report by extracting information from the GIS geodatabase. This integrated system significantly improves surveyor efficiency and enhances the pre-installation process. Below, you’ll find an example of an ‘Routes of Ingress’ map and table produced through this system.
Engineering and Asset Inspection
Our engineers and asset inspectors utilise GIS for several tasks and examples of projects they have been involved in have been provided below.
1 – Hertfordshire County Council Asset Register: RAB collaborated with Hertfordshire County Council to develop an asset register package. The project encompassed various key components, starting with a meticulous evaluation of data, conducting gap analysis, and establishing a GIS geodatabase to store asset location. A mobile inspection form was created to facilitate on-site visual assessments, accompanied by rigorous quality assurance and testing procedures.
In parallel, the team reviewed existing GIS and flood risk data to evaluate each asset’s suitability for inclusion in the registry. This process was complemented by comprehensive visual inspections by our accredited T98 inspectors, which culminated in actionable maintenance recommendations. Additionally, the GIS database allowed the inspectors to use a mobile app to accurately map the asset locations. The wealth of data collected in the GIS geodatabase was harnessed to generate insightful reports that provided a comprehensive view of the assets.
Upon project completion, the client received the GIS geodatabase, complete with layer packages that harmonised with RAB’s inspection reports’ symbology, offering a holistic asset management solution for Hertfordshire County Council.
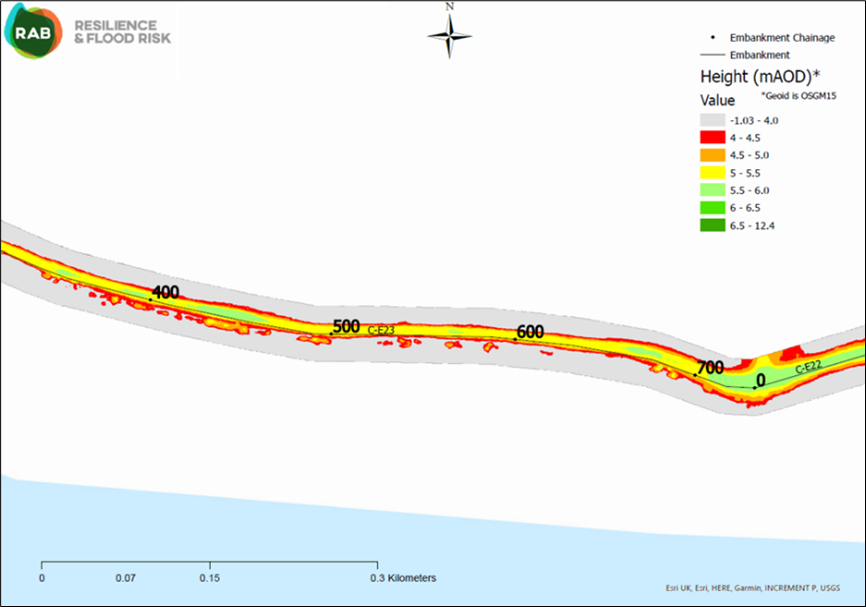
2 – Office of Public Works (OPW) GIS Technical inspections: GIS played a crucial role in utilising OPW’s lidar data to assess and analyse embankment heights and low spots. The detailed data was processed using GIS and added to a single geodatabase. Additionally, GIS assisted our engineers to query the data and select the necessary embankment information required to create detailed visualisations including maps which were used our field engineers and OPW maintenance teams in identifying areas on embankments with low crest heights which in turn facilitated maintenance and management efforts. The ability to compare LiDAR data with both drone and on-site visual inspections, all seamlessly integrated within a GIS environment, was instrumental in enhancing the team’s asset inspections. This integrated approach allowed us to cross-reference and analyse data from multiple sources, providing a comprehensive and accurate understanding of asset conditions. By leveraging LiDAR, drone, and on-site visual inspections within GIS, we can make more informed decisions, identify maintenance needs, and optimise asset management strategies with greater precision and efficiency. An example of a map used by our engineers is shown below.